


Halving and Historical Data Reflect the Potential of Bitcoin
Many traders believe that the upcoming halving event, which is less than 70 days away, is the main factor influencing Bitcoin’s price action.
Bitcoin’s price tends to follow a certain cyclical pattern, and analysts point out similarities between historical patterns and the current price trajectory. This suggests that a price increase cycle similar to those witnessed in the past could occur.
Similarly, historical price surges of BTC seem to adhere to a four-year cycle, often triggered by events such as the Bitcoin halving, which reduces the rate of BTC issuance.
The next halving event is expected to occur in mid-April 2024, when the BTC reward issued to miners per block will decrease from 6.25 BTC to 3.125 BTC.
Data shows that halving is a positive factor for BTC price, and price surges may begin several months before the event—as currently observed—and continue until BTC reaches a new all-time high.
Analysts and cryptocurrency traders, like Rekt Capital, explain the “5 stages of the Bitcoin halving” with the “Parabolic advance” trend being the final stage where BTC price increases exponentially, reaching a new all-time high.
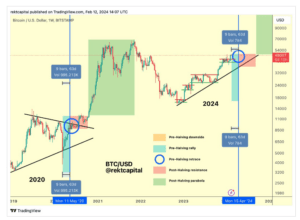
A similar sentiment is shared by independent investor Lady of Crypto, who predicts that Bitcoin’s parabolic uptrend will peak 7 to 8 months after the halving, with BTC breaking its all-time high in November 2024.
Timothy Peterson, Chief Investment Officer at Cane Island Alternative Advisors, agrees that Bitcoin will reach $100,000 by August.

While some traders believe that the 2024 halving will be the most significant event to date, others think that this time might be different.
Capital Continues to Flow into Bitcoin ETF Spot
The influx of funds into Bitcoin ETF spot funds continues to gain momentum. Data from Farside Investor shows that a total of $4.5 billion has poured into Bitcoin ETFs in just over a month since they began trading on January 11.

While outflows from GBTC initially overshadowed inflows into the new ETFs, the tide has turned. BlackRock’s IBIT recorded one of the most successful ETF launches in history by surpassing 100,000 BTC in assets under management (AuM) on February 13.
Demand for Bitcoin ETFs has accelerated this week, with an average of $450 million flowing in daily. On February 16, all AuM of Bitcoin ETF spot funds reached 258,770 BTC – valued at around $13.4 billion at the current exchange rate.
Bitcoin’s Technical Setup Reflects Potential Price Increase for BTC
The Bitcoin price chart has formed a rounded bottom pattern on the weekly chart. Buyers may have set their target at the neckline of the corrective pattern at $69,220, aligning with the all-time high reached in November 2021.
A weekly candle closing above this level would confirm a breakout from the rounded bottom formation, leading Bitcoin to explore higher prices. The Relative Strength Index (RSI) for Bitcoin has moved into overbought territory, nearing the 80-point mark, reinforcing the dominance of the bullish camp in the market.
The exponential moving average (EMA) has also produced a bullish crossover on the weekly chart. This occurred in early January when the 100-week EMA crossed above the 200-week EMA.

Trader Aksel Kibar has identified Bitcoin trading within an ascending parallel channel on the weekly chart, forecasting a rise to $65,000 and beyond.


